Financing Type
open this in its own windowPlease indicate the type of financing mechanism for the proposed solar system.
Please note that not all financing types are available within all states or utility territories. For additional information on solar financing, explore SEIA’s Third Party Financing Overview or the Clean Energy States Alliance Financing Overview. This calculator is able to simulate the following financing types:
Direct ownership: Institutions, municipalities, foundations, endowments, and non-profits, and commercial enterprise can purchase their solar systems using cash. In this case, they are eligible to receive 100% of the electricity savings, all available rebates and incentives, and can claim greenhouse gas emission reductions for the system.
Debt Financing: Debt Financing uses debt to enable entities to purchase a solar system outright and enjoy all the benefits of solar directly; however, some of the initial capital cost is offset by borrowing money in exchange for long term payments. A wide variety of loan or bond offerings are available with different monthly payment amounts, interest rates, lengths, credit requirements, and security mechanisms.
Power Purchase Agreement: In a Power Purchase Agreement (PPA), entities enter into an agreement to purchase electricity from a third party investor who owns and operates the solar installation. The investor is responsible for all operations and risks of the system for a term between 15-25 years. Usually, the PPA rate paid by the customer is less than the current electricity cost ($/kWh).
Operating Lease: The Operating Lease is a third-party-owned financing structure for taxable entities where the investor leases the equipment to the customer. The customer pays scheduled lease payments to the investor for 7-10 years, after which the system is bought out at fair market value.
Tax Status
open this in its own windowPlease indicate the taxable status of your entity.
Being a tax exempt can impact the finances of your solar system (e.g., the Federal ITC, depreciation). Certain types of entities are tax exempt, including: non-profits, educational institutions, municipalities, religious institutions, charitable organizations, social welfare organization, State Agencies, Veteran’s organizations, and Political organizations. For more information, explore the IRS Resources for Tax-Exempt Organizations.
System Size
open this in its own windowPlease enter the size of the proposed solar installation in watts (watts DC).
Typically, the capacity of your solar energy system to produce electricity is described in terms of Direct Current (DC), but you may also see it listed in Alternating Current (AC). The AC size of your solar energy system will always be larger than the DC system size, as the solar modules produce DC power and then utilize inverter(s) to convert it to AC, which is what our home electrical appliances use. This process results in some losses. Learn more about the differences between AC and DC power.
You can calculate the DC size of the system yourself by multiplying the number of panels by the panel wattage (located on the modules themselves, or on the spec sheet), e.g., 20 panels x 320 watts each = 6,400 watts DC. Please note that if you’re receiving proposals from solar companies, the size may be provided in kilowatts (kW) or megawatts (MW). There are many conversion calculators available online.
Year 1 Generation
open this in its own windowPlease enter the amount of electricity that will be generated in the first year of the solar installation.
This information is usually provided to you by the solar developer or installer by using industry standard modeling tools. However, if an estimate has not been provided or if you would like to run your own scenarios, NREL’s PVWatts tool allows users to easily estimate the production of hypothetical systems based on their geographic location. When using PVWatts, if you don’t know the particular details necessary for the inputs, utilize the automatically generated inputs. The final screen will give you a general estimate of the annual kWhs produced by that system. Of note, this tool asks for the system size in kW DC.
Total Installation Cost
open this in its own windowPlease indicate the estimate (or actual) cost of the entire system.
This cost should includes the cost of labor, solar panels, inverters, racking, installation, site development, and utility interconnection. Solar companies should be able to provide an all-in cost for all items that will be required to get the solar installation to full functionality.
If you have not yet received a proposal from a solar company indicating total installed system cost, you can use this NREL report to estimate a preliminary cost for your system. Please note, they differentiate between residential sized systems (~7 kW) and commercial size (~200kW) so be sure to take this into account. Please note that these resources may denote system cost in $/watt so you will need to take the $/watt and multiply it by your system size in watts (DC) to determine the total cost.
System Term
open this in its own windowPlease enter the total expected life of the system.
If you have received a bid from a solar company, they should have listed how many year’s they modeled your system for and you should use that same number for apples to apples comparisons. Solar panels typically have 25 year performance warranties; PV systems being installed can be expected to last 30+ years.
Electricity (Compensation) Rate
open this in its own windowPlease enter the avoided cost rate of electricity produced by your solar system.
This can significantly impact the value and payback of your system as this number is used to value any energy the system produces that you do not use instantaneously. The simplest (and most financially beneficial) case is full retail net metering, where every kilowatt-hour (kWh) produced from the solar installation offsets a kWh from the utility bill at the full retail rate. In this situation it is appropriate to use the current utility rate (kWh) as the electricity rate within this calculator.
In other situations and due to specific electric utility tariff structures or regulatory policies, solar energy cannot be offset on a one-to-one basis and a different rate applies. For example, your utility may compensate you a wholesale rate (~2-3 cents/kWh) or a value of solar rate, which is usually in-between the full retail rate and the wholesale rate, and in some cases, you may not be credited at all for this excess energy production.
Policies on this compensation vary widely by state and sometimes electric utility. Explore this guide for a high-level overview of each state’s policies, as of 2021. Solar contractors are usually well-informed about local net-metering compensations and can inform you of this number. Additionally, you can reach directly out to your electric utility provider and ask how they credit you for excess energy produced by your solar system.
Electricity Rate Escalator
open this in its own windowPlease enter the electricity cost escalator rate.
This is an estimate of the inflation at which the electricity rate will increase. The Energy Information Administration provides historical electricity price data broken down by state and end user type. This historical data can be used to compute a benchmark for the expected future inflation in energy prices. Many solar contractors use an escalator of 2-4% in their modeling. It is recommended to error on the side of a lower escalation rate to ensure the model is providing a “worst case scenario” and not overpromising financial cost and payback.
Debt Amount
open this in its own windowPlease enter the amount of capital that is borrowed (either publicly or privately) to fund the installation of the solar system.
Debt Closing Costs
open this in its own windowPlease enter the total amount of any debt-related transaction and closing costs.
Closing costs are fees and expenses you may have to pay when you close on loan.
Debt Term
open this in its own windowPlease enter the length of the debt agreement in number of years.
For solar installations, certain lenders offer long duration debt ranging up to 20 years, especially if you go through a green bank or similar program.
Debt Interest Rate
open this in its own windowPlease enter the debt interest rate.
Debt interest rate is the annualized interest rate charged on the outstanding balance. Public markets can provide debt at interest rates as low as 3% – 3.5% while private lenders may be in the 6% – 10% range depending on credit quality and term length.
PPA Rate
open this in its own windowPlease enter the PPA rate.
The PPA rate is the price in Year 1 for electricity purchased under the PPA. This is often at a 10%+ discount to the utility rate or avoided rate currently paid by the host site, which results in immediate savings as well as a hedge against future energy costs.
PPA Escalator
open this in its own windowPlease enter the PPA escalator if applicable.
PPAs will often have an escalator which applies to the Year 1 PPA rate. This allows the price of electricity from the solar installation to increase over time in a predefined schedule. Typically this escalator will be lower than the expected inflation in electricity rates, and is usually in the range of 1% – 2%.
PPA Term
open this in its own windowPlease enter the PPA term length.
PPA term is the length of the PPA contract. PPA terms typically range from 15 – 25 years.
PPA Buyout Year
open this in its own windowPPAs will often allow the customer to buyout or purchase the system at certain predefined times during the life of the agreement, typically after the tax benefit period which is in the first six years. For example, a 25 year PPA contract may specify that the customer can purchase the system from the investor in years 7, 15, and 20, allowing them to convert to a direct ownership model early.
PPA Buyout Amount
open this in its own windowPlease enter the PPA buyout amount.
If the PPA has buyout provisions it will also specify that the system can be purchased at those times for the greater of a specified amount or fair market value (FMV). The specified amounts in the buyout schedule are derived from discounting future cash flows from the investor’s point of view. The various items that are taken into account include PPA revenue, incentives, ITC recapture, depreciation, operating expenses, debt service, and taxes. The calculation of the buyout amount is sensitive to the assumptions used and can vary widely by investor.
Annual Lease Payment
open this in its own windowPlease enter the annual lease payment.
Under an operating lease, the customer will pay fixed payments to the investor. This can be in the form of monthly, quarterly, or yearly payments. Please enter the total annual payment for this field. Annual payments for a 7-year solar operating lease typically fall between 9-12% of the total installation cost, though this may vary depending on specific project details and capital provider.
Operating Lease Closing Costs
open this in its own windowPlease enter the operating lease closing costs.
Operating lease providers often charge additional closing costs. Please enter the total amount of those costs here if applicable.
Lease Term
open this in its own windowPlease enter the lease term.
This is the term of the operating lease agreement in years. Residential solar leases are usually for 20 to 25 years. Commercial solar leases can be customized, and generally range from 7 to 20 years.
Lease Buyout Percent
open this in its own windowPlease enter the lease’s buyout percent.
Operating leases will typically have a buyout amount specified as a percentage of the original lease value or fair market value (FMV), whichever is greater.
State Cash Incentives
open this in its own windowPlease enter the total amount of cash incentives received through any State programs.
Numerous states and utilities have incentive programs to accelerate the adoption of solar. These can come in the form of upfront cash incentives, production based payments, or solar renewable energy credits. For example, Wisconsin offers solar cash incentives through the state’s Focus on Energy program. A useful resource to search for incentive programs by region is the Database of State Incentives for Renewables & Efficiency (DSIRE).
SRECs
open this in its own windowPlease enter the SREC schedule in $/MWh for up to 20 years in the table.
Solar Renewable Energy Credits (SRECs) are a performance-based solar incentive based on the solar electricity generation of your system. A solar installation typically generates one SREC for every 1000 kWh of electricity produced, but this may differ depending on local regulatory policy. SRECs trade on the open market and their value fluctuates over time. SREC programs are typically for a 10-15 year period.
Utilities are typically those purchasing SRECs and do so to meet their renewable energy obligations required typically through Renewable Portfolio Standards. While they can provide sizable income to owners of solar power systems that live in states with marketplaces for entities to trade these credits, only a minority of U.S. states have established SREC trading markets. SREC Trade has up to date market data on current SREC prices in different states.
Insurance
open this in its own windowPlease enter the cost of any necessary insurance for your PV system.
All solar projects will require insurance and typically cover general liability insurance and property insurance, environmental risk insurance, business interruption insurance and so forth. Often coverage for your solar can be added into existing insurance policies for little or no cost. Depending on the size and other characteristics of the project, insurance for solar projects typically falls in the $10-$20/kW/year range.
Operations and Maintenance
open this in its own windowPlease enter any O&M costs associated with your project.
Operations and Maintenance (O&M) encompasses all of the activities that will ensure maximum generation from the system throughout its life, including routine maintenance, minor part replacement, and emergency repairs. Solar without battery storage tends to require little maintenance. You do not need to brush off the snow or clean the modules from soot or dust. Production losses due to snow cover and dirt should be included in the power generation estimates provided by your contractor. In fact, the rain and snow tend to help keep the modules fairly clean. It is recommended to inspect the system once annually, looking for loose wiring or modules or other pieces that aren’t working properly.
If you have small staff, have personnel that are already stretched thin, and/or are worried about maintenance requirements, you can often discuss maintenance options with your contractor. Depending on the level of coverage, the cost of O&M is usually in the $10-$25/kW/year range. Contracts can be implemented for durations ranging from a single year up to the expected life of the system. For more detail, explore NREL’s Model of Operations-and-Maintenance Costs for Photovoltaic Systems.
Inverter Replacement
open this in its own windowPlease enter the expected inverter replacement cost.
A solar inverter converts DC current from solar PV panels to AC current that can be used by a local electrical network. Most inverters come with a life-expectancy of approximately 10 years, which is much shorter than the life of the panels themselves (25-30 years). As a result, most inverters need replacement after about 10-15 years of service and replacement costs range $0.08-$0.15/W depending on the specific inverters chosen and size of the overall system.
Panel Degradation
open this in its own windowPlease enter the panel degradation rate.
Solar panel efficiency decreases over time and this is referred to as degradation. The degradation rate depends largely on module technology, weather and quality of materials, however the industry standard rate is around 0.5% per year. Panels in moderate climates such as the northern United States had degradation rates as low as 0.2% per year. But the rate could be as high as 1% in more extreme climates. If you have a particular module in mind, you can find this listed on the PV modules themselves, or on the module spec sheet. For more information, explore NREL’s resource on degradation and module lifetime.
Inflation Adjustment
open this in its own windowPlease enter the standard inflation assumption.
This is the rate by which various operating expenses are escalated year over year. The default is 2%.
NPV Discount Rate
open this in its own windowPlease enter the net present value (NPV) discount rate.
This rate the rate applied to future cash flows to convert them to present day numbers. For more information, explore the NPV Help Section.
ITC Basis
open this in its own windowPlease enter the Investment Tax Credit (ITC) basis.
The ITC basis refers to the portion of the solar installation cost that is eligible to receive the ITC in dollars per watt. This includes the hard cost of equipment, materials, and parts directly related to the functioning of the installation. It also includes certain soft costs such as developer fees, permitting costs, engineering and design fees, and certain construction period interest. For more information, explore this IRS information on the ITC.
Federal ITC
open this in its own windowPlease enter the current Federal ITC rate.
The ITC is a dollar-for-dollar reduction in the income taxes that a person or company would otherwise pay the federal government. Currently, the solar ITC is 30% of the basis that is invested in solar project construction but it subject to change with potential new federal legislation.
INFORMATIONAL NOTE – FEDERAL ITC
Federal Solar Tax Credits for Businesses | Department of Energy
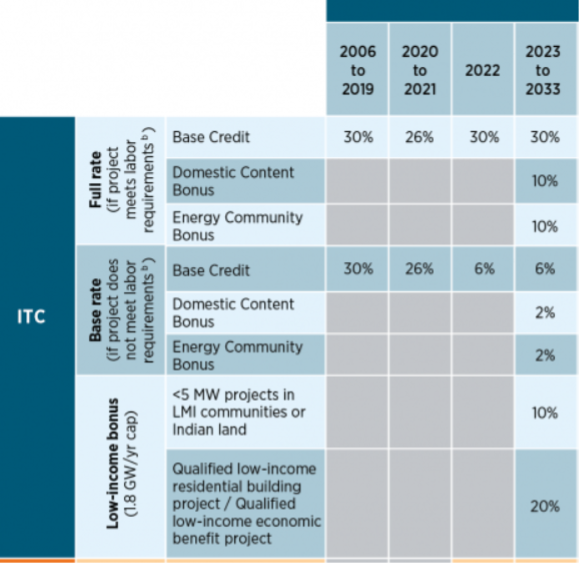
Solar systems that are placed in service in 2022 or later and begin construction before 2033 are eligible for a 30% ITC or a $0.0275/kWh PTC if they meet labor requirements issued by the Treasury Department or are under 1 MW in size.
To qualify for the full ITC or PTC, projects which commenced construction prior to January 31, 2023, must satisfy the Treasury Department’s labor requirements: all wages for construction, alteration, and repair – for the first five years of the project for the ITC and the first ten years of the project for the PTC – must be paid at the prevailing rates of that location. In addition, a certain percentage of the total construction labor hours for a project must be performed by an apprentice. The percentage increases over time, starting at 10% for projects beginning construction in 2022, 12.5% for projects beginning construction in 2023, and 15% for projects beginning construction after 2023.
Projects can correct the prevailing wage requirements, if they were originally not satisfied, by paying the affected employees the difference in wages plus interest and paying a $5,000 fee to the Labor Department for each impacted individual. The apprenticeship requirements also can be satisfied if a good faith effort was made to comply or if a penalty is paid to the Treasury in the amount of $50/hour of non-compliance. Both penalties increase if the requirements are intentionally disregarded.
For more information, see Treasury’s Proposed Regulations
The ITC and the PTC offer additional credits on top of the credits the project qualifies for based on their labor requirements. (Domestic Content Bonus, Energy Community Bonus, Low-Income Bonus)

ITC Basis Reduction
open this in its own windowPlease enter the ITC Basis Reduction.
For solar installations that claim the ITC, the depreciable basis of the asset is reduced by half of the ITC amount. Current tax rules state that this reduction is 50%.
Depreciation Basis
open this in its own windowPlease enter the depreciation basis.
This refers to the percentage of the total system cost that can be depreciated after taking into account the basis reduction due to the ITC. For example, if the ITC is 30% of the system cost, then the depreciation basis will be reduced by half of the ITC amount (15%) for a final basis of 85%.
Bonus Depreciation
open this in its own windowPlease enter the bonus depreciation.
This is an incentive which allows a taxpayer to make an additional deduction of the cost of qualifying property in the year in which it is put into service.
Informational Note: Bonus Depreciation
Starting in 2023, the percentage of capital equipment that can be expensed immediately drops 20% per year (e.g., 80% in 2023 and 60% in 2024) until the provision drops to 0% in 2027.
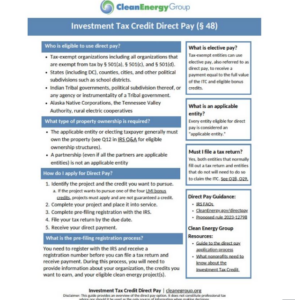
Non-profits are now eligible for the ITC through Direct Pay; they were not before the Inflation Reduction Act.
Federal Tax Rate
open this in its own windowPlease enter your federal tax rate.
For taxable entities, this refers to the income tax that institutions need to pay. This is used to compute the dollar benefit of the various tax incentives that solar projects are eligible for.
MACRS Depreciation Schedule
open this in its own windowPlease enter the MACRS depreciation schedule.
MACRS stands for Modified Accelerated Cost Recovery System and is a method of depreciating assets. Solar projects are long term infrastructure assets that are allowed to use a 5-year accelerated depreciation schedule. For more information, explore:
Initial Capital Cost
open this in its own windowPlease enter the initial capital cost of the project.
This represents the total upfront cost of the solar installation. Typically, these costs will include the modules, inverters, racking, balance of system (BOS), labor, permitting, utility interconnection fees, and profit and overhead costs of a solar system.
Avoided Electricity Cost
open this in its own windowThe total avoided cost of electricity that is provided by the solar installation. This is due to offsetting energy that would otherwise have been purchased from the utility. The rate at which each kWh of solar offsets grid purchased electricity can vary from a simple one-to-one ratio to more complicated mechanisms depending on tariff structure and local regulations.
Operating Expenses
open this in its own windowOperating expenses refers to all of the expenses required for the solar installation to function to specification. This includes regular maintenance, emergency repairs, scheduled equipment replacement, and insurance coverage.
Federal Taxes
open this in its own windowFederal Taxes refers to the taxes paid on net revenues from the solar installation including avoided costs and state incentive programs.
IRR
open this in its own windowIRR stands for Internal Rate of Return and is the standard way of measuring the returns from solar projects. IRR is used mainly because it accounts for the varying levels of revenues, incentives, and expenses from year to year and provides an effective annualized rate. Typically, the higher the IRR value is indicates a more favorable project for investment.
http://www.investopedia.com/terms/i/irr.asp
NPV
open this in its own windowNPV stands for Net Present Value and represents the value of future cash flows in today’s value by discounting them at the appropriate rate. This allows for the analysis of projects that have long term cash flows and time horizons. Positive NPV numbers indicate a good economic investment, while negative NPV indicate a project’s economics are less than optimal.
http://www.investopedia.com/terms/n/npv.asp
LCOE
open this in its own windowLCOE stands for Levelized Cost of Energy and is a metric that represents the lifetime average cost of electricity produced by a solar installation, taking into account all revenues and costs. This provides a benchmark to compare against when analyzing the economic benefits of solar vs other sources of electricity.
LCOE = lifetime costs / lifetime electricity produced
https://en.wikipedia.org/wiki/Cost_of_electricity_by_source#Levelized_cost_of_electricity
EBT
open this in its own windowEBT stands for Earnings Before Taxes and is an accounting subtotal line.
Net Income
open this in its own windowNet Income is a line item which shows the accounting profit/loss for a given year. Due to non-cash items such as depreciation, this will differ from the actual cash flow benefit.
Total Lifetime Benefit
open this in its own windowTotal Lifetime Benefit is the sum of the Net Economics line in the Cash Flow Projections table. This aggregates the economic benefits of solar from a cash-flow perspective (as opposed to net income which is an accounting measure). This is the true bottom line of the solar installation.
PPA Payments
open this in its own windowPPA Payments is the total amount paid for the electricity purchased from the solar system under the power purchase agreement. This is determined by the amount of electricity produced multiplied by the predetermined PPA rate for that given year.
Debt Interest Payment
open this in its own windowThe Debt Interest Payment is the interest only portion of the debt payment and is used to offset the federal taxes of the solar installation. This is analogous to how mortgage interest is deductible from personal income taxes.
Yearly Benefit Graph
open this in its own windowThe year by year benefit of the system taking into account all revenues and expenses
Cumulative Benefit Graph
open this in its own windowThe cumulative economic benefit of the system over its lifetime
Utility Savings Graph
open this in its own windowThe yearly avoided cost due to the electricity produced by the solar installation
Utility Rate vs LCOE Graph
open this in its own windowA comparison of the avoided rate of grid electricity vs the levelized cost of solar energy
Utility vs PPA Rate Graph
open this in its own windowA comparison of the avoided electricity rate vs the PPA rate